Amsterdam · International

Tools that turn improvement into results.

CI Workx is the independent platform for organizations and professionals who apply Lean Six Sigma. Assess maturity, develop capability, analyze data and deliver improvement projects from one coherent suite.

The product suite

A connected toolkit for continuous improvement.

Use each tool on its own or combine them in one license for a stronger, more consistent improvement system.

Colleagues working together to improve their organisation

CI-Assess

Measure and discuss your organization's Continuous Improvement maturity.

  • Maturity assessment by domain
  • Priorities and development roadmap
  • Clear management reporting
Explore CI-Assess →
Professionals learning together in a continuous improvement workshop

CI-Learn

Learning, assessment and certification from one environment.

  • Curricula and eReader content
  • Exams and vouchers
  • Progress by participant
Explore CI-Learn →
A professional analyzing data on a laptop in a modern office

CI-Analyze

Accessible data analysis for Lean Six Sigma and process improvement.

  • Analysis, capability and MSA
  • DOE and process mining
  • Clear live visualizations
Explore CI-Analyze →
A cross-functional team collaborating on an industrial improvement project

CI-Project

Bring structure to DMAIC, PDCA and 8D projects—from charter to control.

  • Phases, actions and ownership
  • Evidence, progress and reports
  • In development
Explore CI-Project →
CI-Analyze

Analysis tools, from process map to prediction.

Explore the full tool catalog and see selected input screens and output visuals from CI-Analyze.

Open CI-Analyze

All categories and tools

No matching tools found.

Quality Planning4 tools
  • Project Charter
  • CTQ Flowdown
  • Fishbone (6M)
  • 5 Why
Data & Descriptive Statistics6 tools
  • Generate data
  • Data by Formula
  • Descriptive statistics
  • Tally / Frequency Table
  • Cross Tabulation & Chi-Square Association
  • Graphical Summary
Graphs9 tools
  • Word Cloud
  • Pie Chart
  • Bar Chart
  • Pareto Chart
  • Time Series Plot
  • Scatter Plot
  • Bubble Plot
  • Histogram
  • Boxplot
Process Mapping & Mining6 tools
  • Process Flow Mapping
  • Swimlane
  • SIPOC
  • Sankey Diagram
  • Value Stream Mapping
  • Process Mining
Measurement System Analysis3 tools
  • Type 1 Gage Study
  • Gage R&R Study
  • Attribute Agreement Analysis
Distributions3 tools
  • Distribution Identification
  • Distribution Explorer & Probability
  • Data Transformation
Statistical tests14 tools
  • Generate Hypothesis
  • 1-Sample Z
  • 1-Sample t
  • 2-Sample t-test
  • Paired t-test
  • ANOVA
  • 1-Sample nonparametric test
  • Mann–Whitney test
  • Nonparametric comparison
  • Analyze Variation
  • Compare Proportions
  • Chi-square Goodness-of-Fit
  • Compare Rates
  • Power & Sample Size
Correlation & Regression2 tools
  • Correlation
  • Regression
Design of Experiments3 tools
  • DOE Design
  • DOE Analyze
  • Response Optimizer
Predictive Analytics & Simulation2 tools
  • Predictive Analytics
  • Monte Carlo Simulation
Process Performance4 tools
  • Overall Equipment Effectiveness
  • Run Chart
  • Capability Analysis — Cpk & Ppk
  • Process Capability for Attribute Data
Statistical Process Control2 tools
  • SPC for Continuous Data
  • SPC for Discrete Data
Reliability6 tools
  • Reliability Analysis
  • MTBF / MTTF
  • Accelerated Life Testing
  • Reliability Demonstration Test
  • Reliability Growth
  • HALT / HASS Analysis

CI-Analyze screens

Screens captured from CI-Analyze using demo data. Open an image to view it at full size.
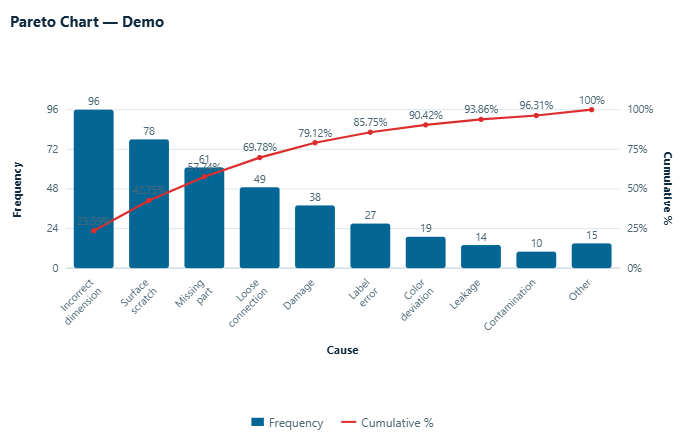
Pareto chart with bars and cumulative percentage from a CI-Analyze demo
GraphsPareto ChartOutput visual · Click to enlarge
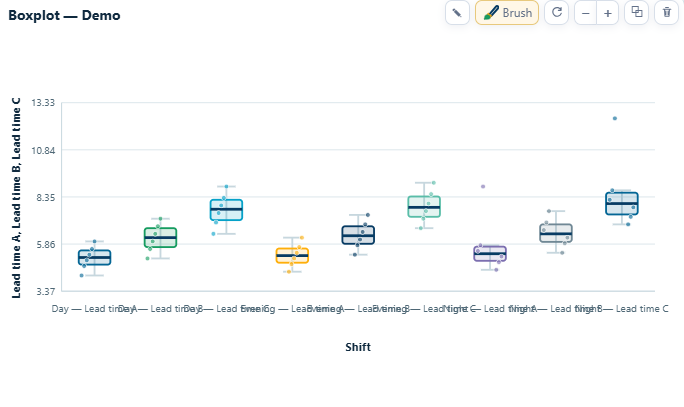
Boxplots comparing lead time across shifts in CI-Analyze
GraphsBoxplotOutput visual · Click to enlarge
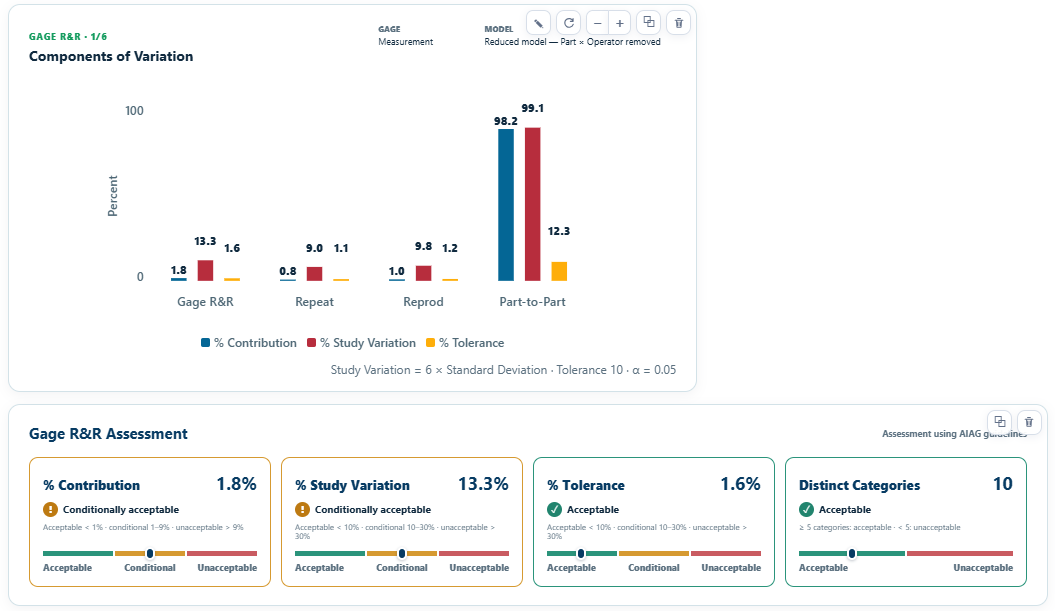
Gage R&R components of variation and measurement assessment
Measurement System AnalysisGage R&R StudyOutput visual · Click to enlarge
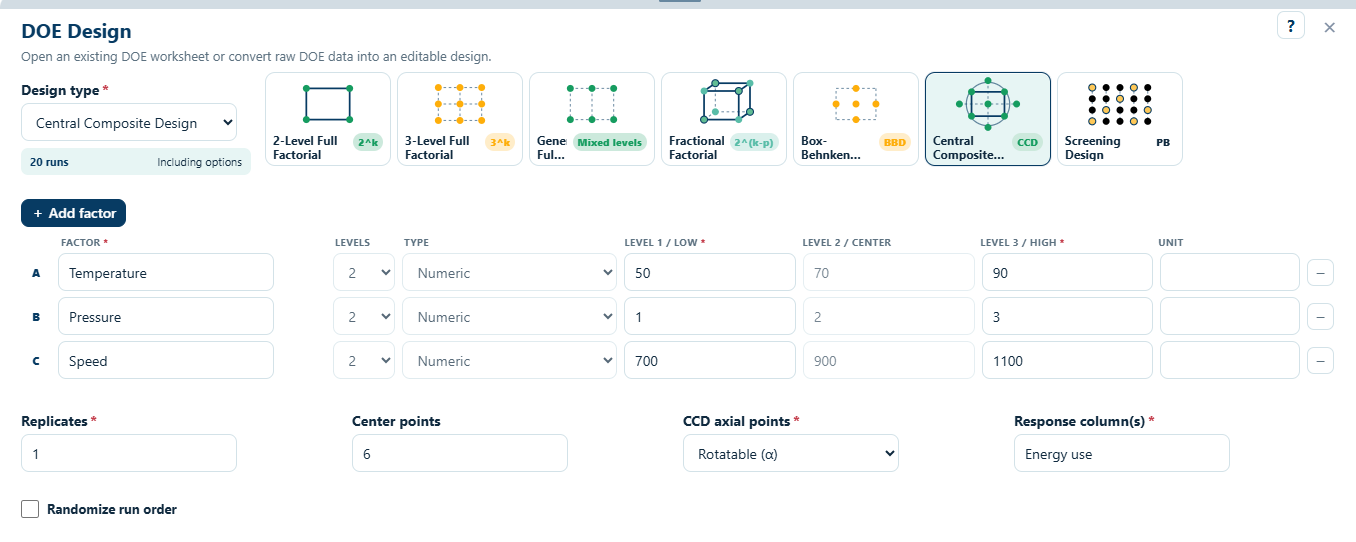
CI-Analyze DOE Design input screen with Central Composite Design selected
Design of ExperimentsDOE DesignInput screen · Click to enlarge
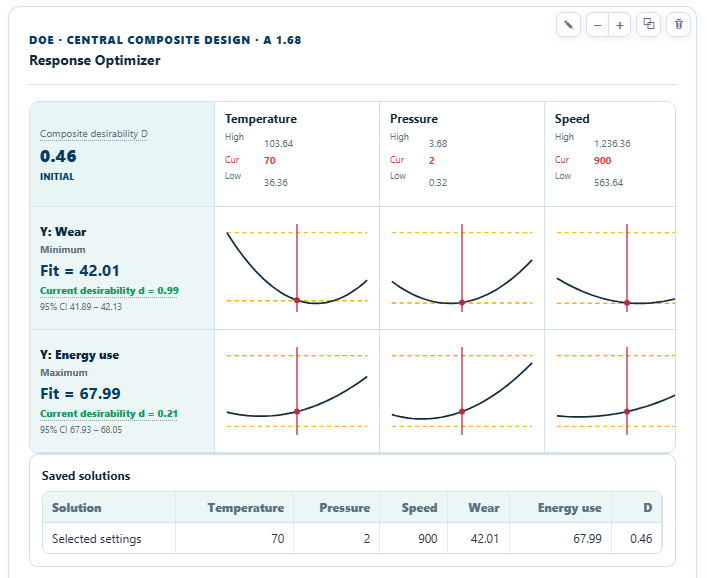
CI-Analyze Response Optimizer output with factor profiles and solution
Design of ExperimentsResponse OptimizerOutput visual · Click to enlarge
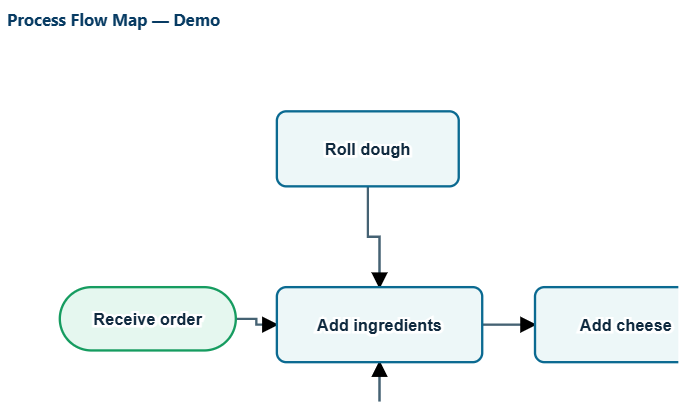
CI-Analyze process flow map demo with connected activities
Process Mapping & MiningProcess Flow MappingOutput visual · Click to enlarge
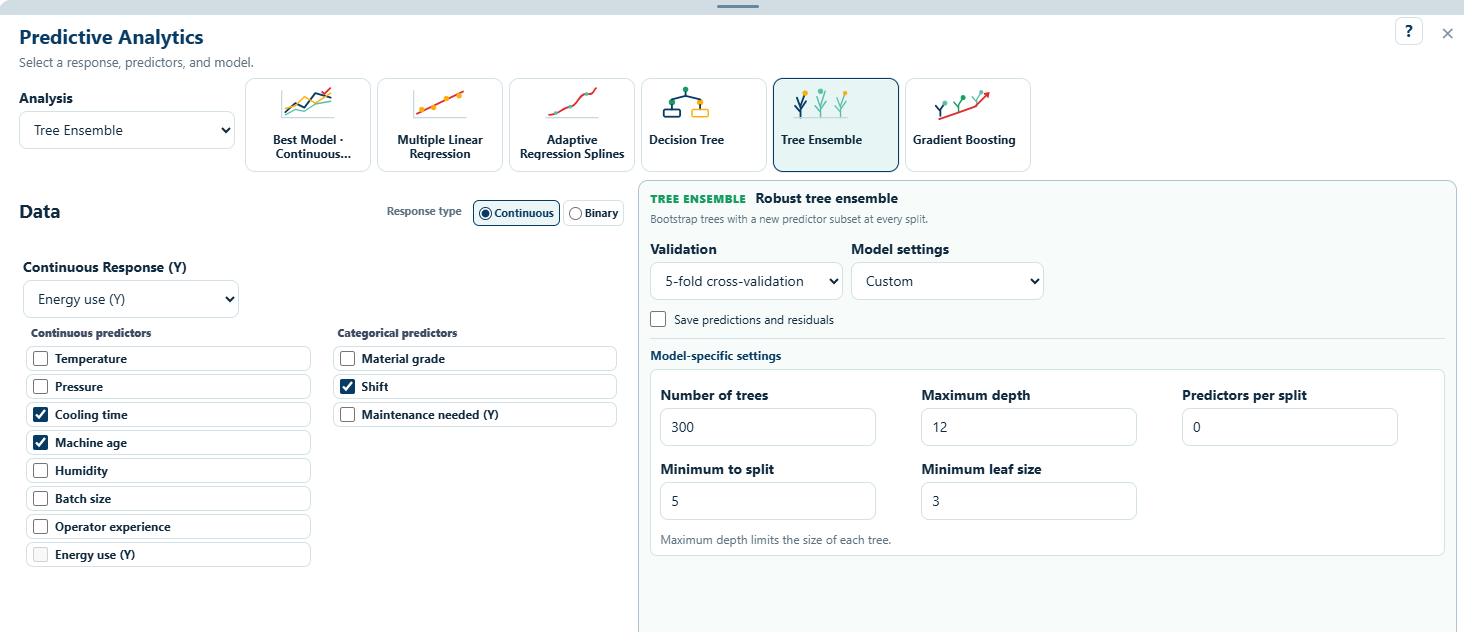
CI-Analyze Predictive Analytics input screen with Tree Ensemble selected
Predictive Analytics & SimulationPredictive AnalyticsInput screen · Click to enlarge
Product licenses

Choose the license that fits the way you work.

Prices excluding VAT.

CI-Assess

  • Single€ — / month
  • Business€ 495.00 / team / yr

CI-Learn

  • Yellow Belt€ 20.00 / month
  • Orange Belt€ 25.00 / month
  • Green Belt€ 30.00 / month
  • Black Belt€ 35.00 / month

CI-Analyze

  • Light - (Educational)€ 20.00 / month
  • Pro - (Educational)€ 30.00 / month
  • Light€ 35.00 / month
  • Pro€ 60.00 / month

CI-Project

  • Single (1 PM)€ 20.00 / month
  • Business (10 PMs)€ 125.00 / month
Platform administration

One place to manage your improvement ecosystem.

The central administration environment is being developed alongside the four CI‑Workx applications.

Organizations

Structure teams, business units and application access from one central environment.

Users & roles

Manage participants, trainers, project managers and administrators with clear permissions.

Licenses & vouchers

Issue and manage access for individual users, teams and training programs.

Portfolio insight

Bring assessment, learning, analysis and project activity together in a coherent overview.

CI Workx

Ready to build a stronger improvement system?

Based in Amsterdam. Built for international improvement communities.

For whom

Built around the way improvement is delivered.

From global transformation teams to independent experts: choose a focused tool or build a connected platform.

Enterprise teams

Create a common improvement language, govern portfolios and turn progress into clear management insight.

Accredited Training Organizations

Run learning programs, assessments and certification at scale under your own training operation.

In-house professionals

Practical, affordable tools for daily analysis, learning and project delivery.

Independent experts

A professional toolkit that supports client work without heavyweight enterprise software.

One connected proposition

From insight to sustained execution.

01Assess

CI-Assess makes maturity visible.

02Build capability

CI-Learn develops people and validates learning.

03Decide with evidence

CI-Analyze turns data into practical insight.

04Deliver and sustain

CI-Project guides improvement work to completion.